Customer Segmentation with Machine Learning: Let’s imagine the following scenario. A big company with a large pool of customers wants to launch a marketing campaign for a new product. The product has a lot of uses and offers different values to different customers, so the company shouldn’t advertise it in the same way to everyone.
At the same time, preparing different ads and slogans for each individual customer is infeasible. The company would like to find a golden mean: divide customers into a number of groups and have a separate strategy for running a campaign in each group. There is one caveat though: the groups need to be coherent. If two customers end up in the same group, they must be similar in some fashion. At the same time, customers from different groups should differ significantly.
Customer Segmentation with Machine Learning: The Problem
This is one example of customer segmentation with machine learning (Picture 1). It’s a real-life problem that requires splitting a big data set into several smaller, coherent parts. Depending on the size of a data set, a team may or may not be able to do this manually. When dealing with a larger scale, we need an automated solution. It’s a good thing if we don’t have a lot of variables describing each object (or data point); we can then think of simple, sensible rules that would solve the task. However, when we want to combine information coming from a lot of different features (and do it quickly), we have to come up with a more complex approach.

Picture 1: Customer segmentation
In artificial intelligence terms, we call the problem described above ‘clustering.’ There is a class of machine learning algorithms designed specifically for solving this task. Unlike classification and regression methods, these algorithms are able to operate on unlabeled data, so they don’t require us to assign a ground truth value to each data point. This is very useful for bringing structure to a collection of information at a minimal cost. This ability of clustering techniques to detect patterns in raw data makes them unsupervised learning methods.
Customer Segmentation with Machine Learning: K-Means
Probably the most well-known and commonly used clustering algorithm is k-means clustering. Look at the picture below to get an idea of how it works:
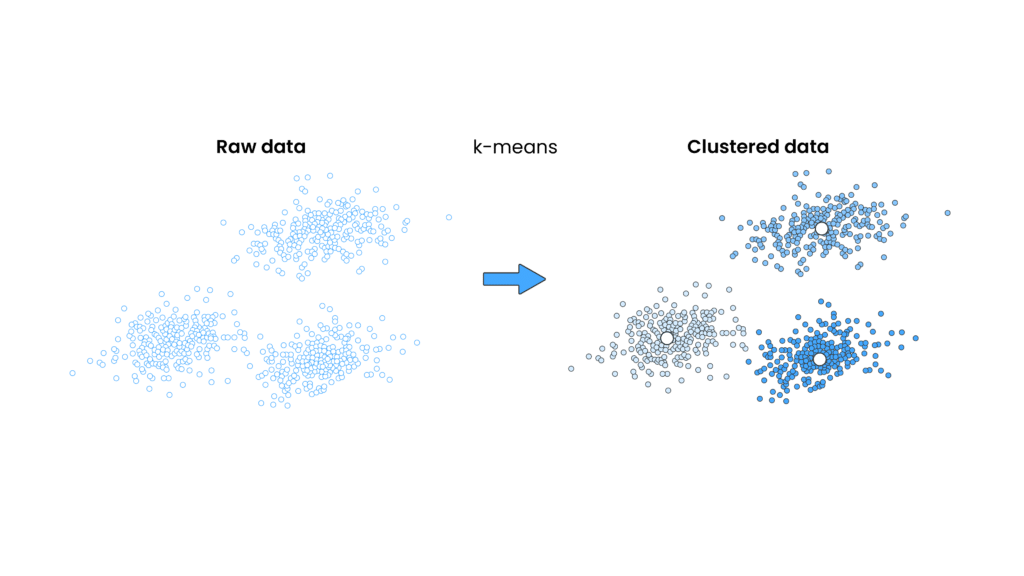
Picture 2: Example result of k-means clustering algorithm on a two-dimensional data set. On the left-hand side, we see raw data without any grouping. We can clearly notice three visibly distinct clouds of points. On the right-hand side, there is the same data set, after clustering. The algorithm has now detected the groups (clusters) that we could identify only visually before. Black dots represent the cluster centers.
Time to get down to the nitty-gritty. To tell whether two data points are similar or not, we need a way of measuring this similarity. In k-means clustering, the way to do this is to compute euclidean distance between the points. For non-mathematicians, in 2D space (that is, an infinite sheet of paper) this just means measuring the straight-line distance with a ruler. Once we know how far apart each pair of points is, we can evaluate the coherence of a given group. In k-means, we do this by checking the distances from the group center to each of the points in the group. We then square and add these numbers together – we obtain a value called WCSS (within-cluster sum of squares). The lower the WCSS, the closer the points within a group are.
How K-Means Groups Customer Data
The goal of k-means clustering is to split all data points into a given number of clusters in a way that minimizes the total sum of WCSS values for all groups.Usually, we designate this number as k (hence the name of the algorithm). To use k-means, we need to choose the k value upfront.
How the K-Means Algorithm Works
The algorithm then performs the split during an iterative procedure. We start from a grouping that is quite poor and improve it with each iteration. First, the algorithm picks initial cluster centers (called centroids) at random. They help define a grouping – the algorithm assigns each data point to one of the centroids. Points that are assigned to the same centroid form a cluster. Simple. After initializing the centroids, the algorithm repeats two steps alternately:
- Assign each data point to the nearest centroid;
- Move each centroid to the mean of the data points assigned to it.
Wait, Wait, What?
Let’s describe it in slightly less mathematical words. In each iteration, the algorithm assigns data points to clusters and moves the cluster centers. These two actions cause the total sum of WCSS values to shrink with each subsequent repetition. It is not the goal of this article to present proof why this is true; you can find more about it in the links below. The point is that, with each iteration, the data is clustered better and better. The procedure finishes when subsequent iterations do not introduce any changes in groups. Once that happens, we have found the solution.
The great thing about k-means is that it doesn’t require complex parameterization; there are only two things we need to worry about before running the algorithm. The first is preparing the data: in our customer segmentation example, this would mean creating a data set where we describe each customer with a set of numerical values.
Anything that can be represented as a number, can be a feature; for example, the frequency of buying the company’s products, or the time passed since the first purchase. The second thing we need to take care of is choosing the number of clusters…But the algorithm is quite fast anyway, so we can just test a lot of k values and pick the one with the best result, right? Well, yes! This is exactly how we optimize this number.
Do I Need Anything Else?
Like all other machine learning algorithms, k-means has its assumptions and limitations. It will not work very well when the true clusters in a data set are not spherical or are imbalanced in size. In such a case, the clustering result would be drastically different from what we would expect. This is not a reason to belittle k-means’ utility though, far from it! It just shows that there is no universal approach to solving all problems. We always have to pick the right tool for the job.
Fortunately, there are many other clustering algorithms, requiring different conditions to be met to give satisfactory results – for example, density-based DBSCAN, hierarchical BIRCH, or fuzzy clustering. Most of these are available in a great Python library scikit-learn. If you are interested in their uses and differences, we encourage you to fire up a Jupyter Notebook and play with them yourself.
Side note: two-dimensional data set from Picture 2 is just a convenient example. In practice, k-means is not limited to two dimensions. We can have any number of numerical features describing each data point. We still need to remember about the curse of dimensionality though; too many features may make euclidean distance meaningless due to the data sparsity.
Have fun!
Next steps & further reading
If you want to explore how Customer Segmentation with Machine Learning can reveal patterns in customer data, the best starting point is a small, controlled pilot based on a clearly defined dataset and business goal.
At Stermedia, we help organizations analyze data and build machine learning solutions — from data preparation and exploratory analysis to production deployment.
Want to discuss your data project? Contact our AI team
Continue reading:
- Dimensionality Reduction – Don’t Confuse Your Model – how reducing unnecessary dimensions can make machine learning models easier to train and interpret.
- Predictive Analytics in Business: Turning Data Into Foresight – how organizations move from finding patterns in historical data to predicting future business outcomes.
- How to Use Simple Math Models for Major Business Challenges – a practical example showing how well-designed analytical models can solve real business problems without unnecessary complexity.
Further reading:
Wikipedia k-means page: https://en.wikipedia.org/wiki/K-means_clustering
Stanford University handout: https://stanford.edu/~cpiech/cs221/handouts/kmeans.html
On k-means limitations: http://varianceexplained.org/r/kmeans-free-lunch/
Deep overview of clustering methods: https://scikit-learn.org/stable/modules/clustering.html