Nowadays, the picture of agriculture is far from that of old machines and manual work. In more and more situations, modern technologies such as Cow Monitor support this branch of the economy. An example of this is the Cow Monitor App system.
This app system was created as a helpful tool for cattle breeders in their daily work. It automatically collects information from the body of cows and makes it available in a simple and convenient way on the screen of a smartphone, tablet, or computer. As a result, cattle breeders can access this information everywhere with an internet connection.
Cow Monitor System Components
The Cow Monitor system consists of two components: Cow Device and Wallpoint. The Cow Device is a cow-mounted apparatus that contains a replaceable battery and is made of very durable plastic. Two “loops” mount the device on the belt, so there is no risk of losing the device (which is common in the case of products in the form of an earring).
In the Cow Monitor system, Wallpoint is a device that receives signals from Cow Device and enables localization. During its 3 years of testing, only one problem has occurred. Moreover, using Wallpoints in excessive numbers guarantees the stability of the system.
What Are the Most Important Functions of the Cow Monitor System?
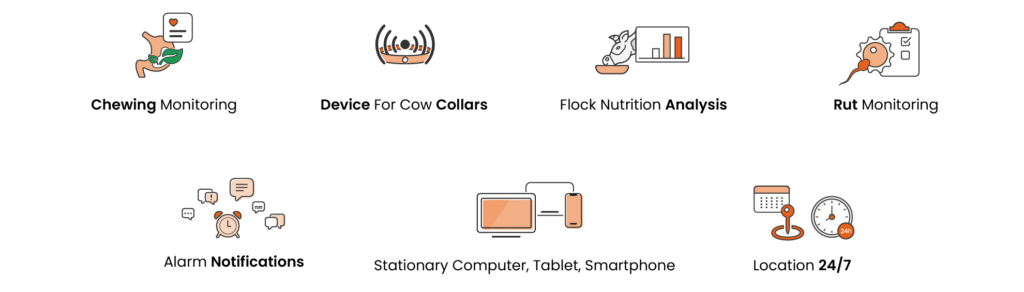
Heat detection
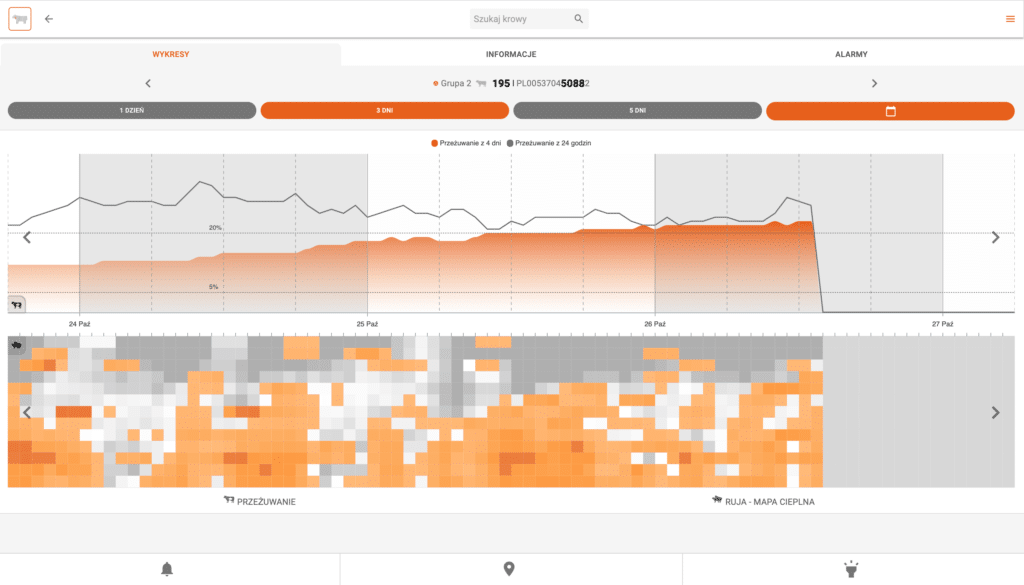
This functionality allows the application to provide breeders with information about sexual activity with unprecedented accuracy. It shows the hour-by-hour behavior of the cow. The Cow Monitor system automatically sends a notification about the heat to a smartphone, tablet, or computer. By simply comparing the cow’s behavior in history, the breeder is more effective in deciding when to inseminate.
Chewing for a single piece
Rumination monitoring is a great idea to show the health of a cow. The Cow Monitor system notifies about health threats. As a result, the farmer has more time to diagnose and treat. The information applies to diseases of the gastrointestinal tract and all diseases associated with fever.
Chewing for a group
Knowledge about the dynamics of rumination in terms of the group is excellent material for making decisions about cow feeding. It shows (24/7) what proportion of the herd is chewing in a stable way and how this is fluctuating.
Location
This service is very useful for large herds. The Cow Monitor system shows the real-time location of the cows in the app and allows you to light the LED on the cow’s neck. In addition, the system can light the LEDs for many cows at the same time to mark cows for breeding or veterinary work. The red light remains visible from a long distance away.
Manual alarms
The application is a tool for the simple transfer of information about the cow. Each user can submit a comment in a very simple way by checking a few boxes in the form. Everyone who has access to this information will receive a push notification on devices where they use the application. The application logs each alarm in that cow’s history.
Automatic alarms
When the cow is sending important health (by reducing rumination by more than 5%) or oestrus signals, the Cow Monitor system identifies this event as an alarm. It then sends an automatic push notification. For oestrus, the app indicates information about its beginning and end. For rumination, the system repeats the decrease every 18 hours.
Operating range
Cow Device operates in the cowshed and in the immediate vicinity of the cowshed. Its durable design means users need to change the battery no more often than every 3 years. The system is adapted to the specific buildings where it is placed. The operating range of the system is several meters from the building that houses the animals.
Lameness detection
Ongoing development constantly expands the analytical part of the Cow Monitor system to enable comprehensive monitoring of animal welfare with a single device. In 2020, work began on algorithms for lameness diagnosis, with the goal of effectively detecting its early stages (2 and 3 of the Zinpro scale).
How Did Stermedia Help?
Challenges and results in heat detection
The work of the Stermedia team began by dealing with an error that appeared in the heatmap charts. The Stermedia team observed data inconsistency. The charts presented in the application differed from the adopted assumptions by one day and showed different data.
It was Stermedia’s first assignment. The project was managed by Rancher – a complete software stack for teams adopting containers. Rancher addresses the operational and security challenges of managing multiple Kubernetes clusters while providing DevOps teams with integrated tools for running containerized workloads.
The team set up a three-node Kubernetes cluster using an EC2 instance with AWS and the RDS database.
Challenges and results in locating cows
The next challenge was to propose communication from the app to the device and back again. Until then, the system only received cow data, so the task was to pass it on to the farmer. After a few months, there was a challenge to additionally locate the cow in the herd. Each animal carries a device with a locating diode. Stermedia’s task was to prepare the MQTT broker (it is intended for transmission for devices that do not require high bandwidth), write the service, and implement this functionality on AWS Cloud. From the backend side, a container with the MQTT broker was issued.
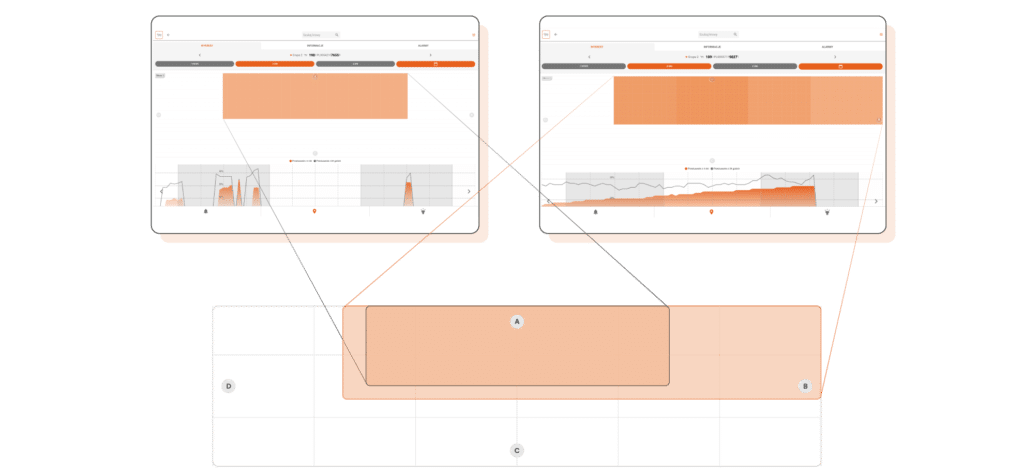
The team established an internal communication system so that the data collected in the application can precisely define the request to light the LED. Wallpoint pulled information from the broker and sent an LED light request to the cow device so that the system could locate the animal. The chart showed the cow’s location within the barn.
The diagram below shows an overview of the cowshed. Points A, B, C, and D correspond to certain parts of the world. The letters are intentionally used here because they are easier to navigate. The more orange the color, the greater the probability that a given cow is located in a given place. Therefore, the system implements localization algorithms here. They were the subject of research of the Wrocław University of Technology, which proposed their implementation. Then Stermedia adapted them to the needs of the application and issued them via API.
The challenges and results of monitoring rumination
The next step was to create the rumination charts. A graphic designer helped prepare the visualization, while Stermedia handled the visual implementation and provided data for the charts.
In addition, Stermedia took care of detecting device failures. If something happens to the device, the application displays the information. The device has its own system that has markers to signify if something is going on with the device. The team selected a package of potential events and implemented it in the system.
Using AWS Cloud
Finally, one of the most interesting elements in this project from the point of view of our programmers was the management of AWS Cloud containers. These algorithms collect and convert the data generated into charts.

How Have Stermedia Helped Farmers Take Better Care of Their Animals?
Thanks to the work of the Stermedia team, the CowMonitor system has been significantly improved. Components such as heat monitoring, chewing, location monitoring, and an element related to detecting device failure have appeared. Overall, the work has aided in the functioning and efficiency of the CowMonitor system – this is helping farmers provide even better care for the animals they care for.
Next steps & further reading
If you want to explore how a connected monitoring system like Cow Monitor can support livestock operations, the best starting point is one clearly defined monitoring challenge, such as health alerts, rumination, or location.
At Stermedia, we help companies build and improve connected software systems — from cloud infrastructure and backend services to data visualization and device communication.
Want to discuss your project? Contact our team
Continue reading:
- Stermedia became AWS Select Consulting Partner – more about Stermedia’s experience with AWS and cloud solutions.
- AI-Driven Energy Management System for Industrial Compressors – another case study combining sensor data, monitoring and scalable infrastructure.
- Data Visualization Software for 3000 Daily Records – how Stermedia turned large volumes of operational data into accessible charts and views.